Dashboard
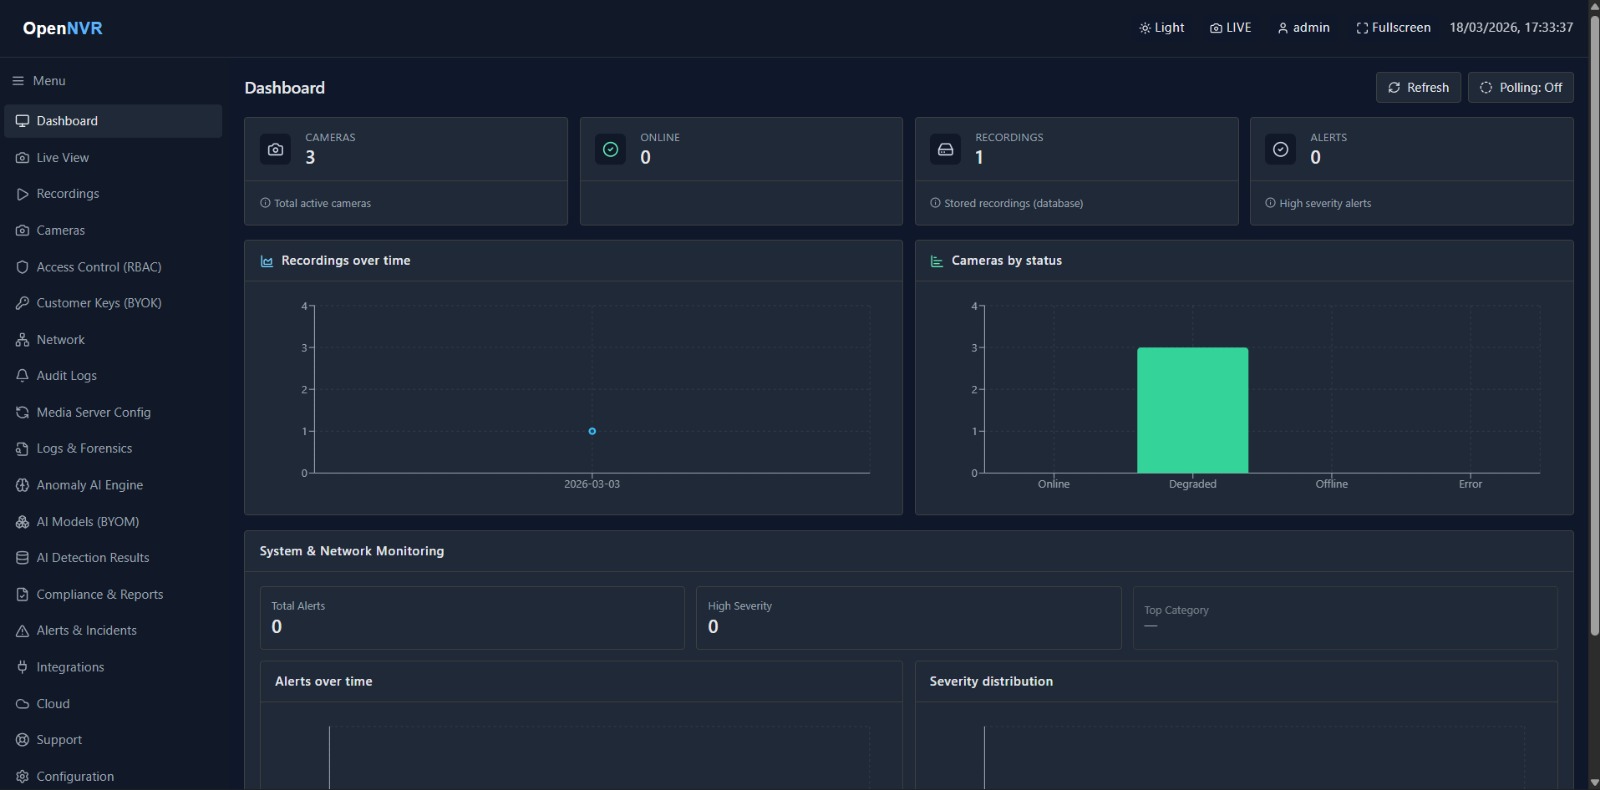
The OpenNVR home screen — camera counts, online status, recording totals, alert counts, and system/network health at a glance.
On this page
The Dashboard is the landing screen at / and the first item under NVR → Dashboard in the sidebar. It rolls up your fleet into four KPI tiles, two trend charts, and a live system/network panel. The Dashboard is always visible — it has no permission gate, so every signed-in user can open it (the data shown still respects each user’s camera access).
What you can do here
- See total cameras, how many are Online, stored Recordings, and high-severity Alerts at a glance.
- Jump straight to the related tab by clicking a KPI tile.
- Watch Recordings over time and Cameras by status trends.
- Turn on background polling to keep the numbers fresh, or refresh on demand.
- Review live System & Network Monitoring below the charts.
Read the KPI tiles
The top row has four tiles. Three of them are clickable shortcuts.
| Tile | Shows | Click goes to |
|---|---|---|
| Cameras | Total cameras (Total active cameras) |
Cameras tab (/cameras) |
| Online | Cameras currently streaming real data | — (not clickable) |
| Recordings | Stored recordings (Stored recordings (database)) |
Recordings tab (/playback) |
| Alerts | High-severity alert count (High severity alerts) |
Alerts & Incidents, filtered to severity 1 |
[!NOTE] Online counts only cameras whose live path is ready and actually receiving data (bytes flowing). A camera that is provisioned but not yet streaming shows as Degraded in the status chart, not Online. If the Media Server is still starting up, the Online count may read
—briefly.
Refresh and auto-poll
- Click Refresh (top-right) to reload cameras, recordings, and alerts immediately. The icon spins while a refresh is in flight.
- Click Polling: Off to switch it to Polling: On — the Dashboard then re-fetches every 30 seconds on its own. Click again to stop.
Read the charts
- Recordings over time — an area chart of how many recordings exist per day.
- Cameras by status — a bar chart grouping cameras into Online, Degraded, Offline, and Error.
A camera lands in Error when its status is error or failed, Online when data is flowing, Degraded when it is provisioned/active but no data is flowing yet, and Offline otherwise.
System & Network Monitoring
Below the charts, the System & Network Monitoring panel shows live host and network health. See System Monitoring for what each metric means.
[!TIP] If a KPI tile shows an error card instead of a number (for example “Failed to load cameras”), use the card’s Retry action — it re-runs just that query without reloading the whole page.
📸 Screenshots to capture
This page reuses the existing dashbord.jpeg. No new screenshots are required. If you want fresher shots, capture:
dashboard-kpis.png— a close-up of the four KPI tiles with real numbers and the Refresh / Polling buttons.dashboard-charts.png— the Recordings over time and Cameras by status charts side by side.